January 6th, 2025
New
Release 0.5.19
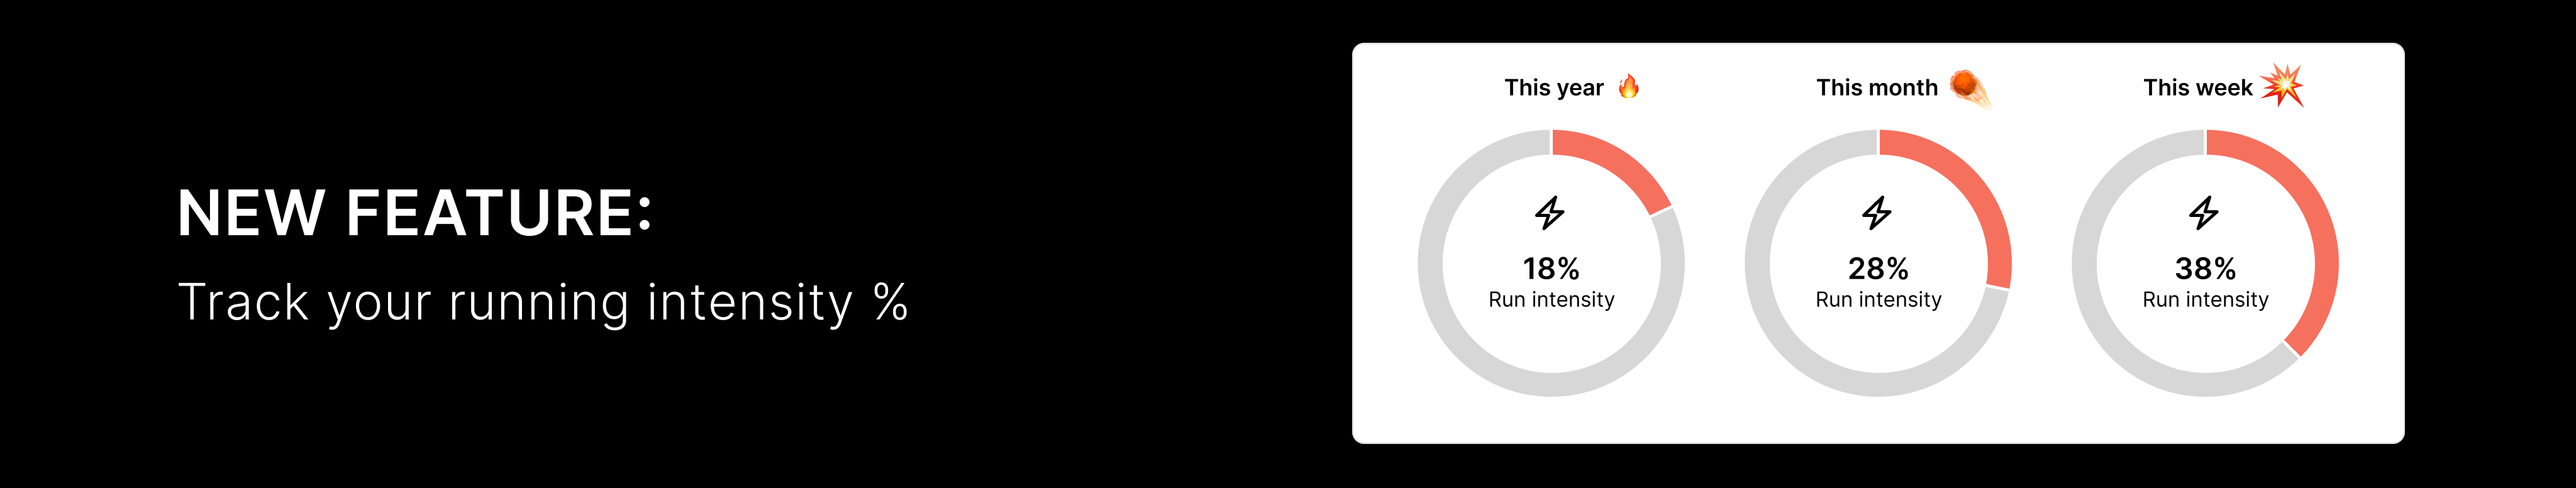
We’ve released another much asked for feature - tracking your intensity ⚡️
You can now see the intensity proportion of your total running distance in KULG (both on desktop and mobile) without having to calculate it yourself. You can still track your intensity distribution in distance as well on the “Intensity” chart under Dashboard.
You can see the run intensity % by specific time. Simply select a predefined time frame like this week/ month/ year or choose suitable custom dates and see how much of your running in that period was hard vs easy.
You can also see the run intensity % filtering by type of run. By selecting e.g. “Hill run”, you can see how much of the total distance covered on hill runs included high intensity training. This context helps interpret the runner’s progress from other charts on the Dashboard.
→ Read more about Activity summary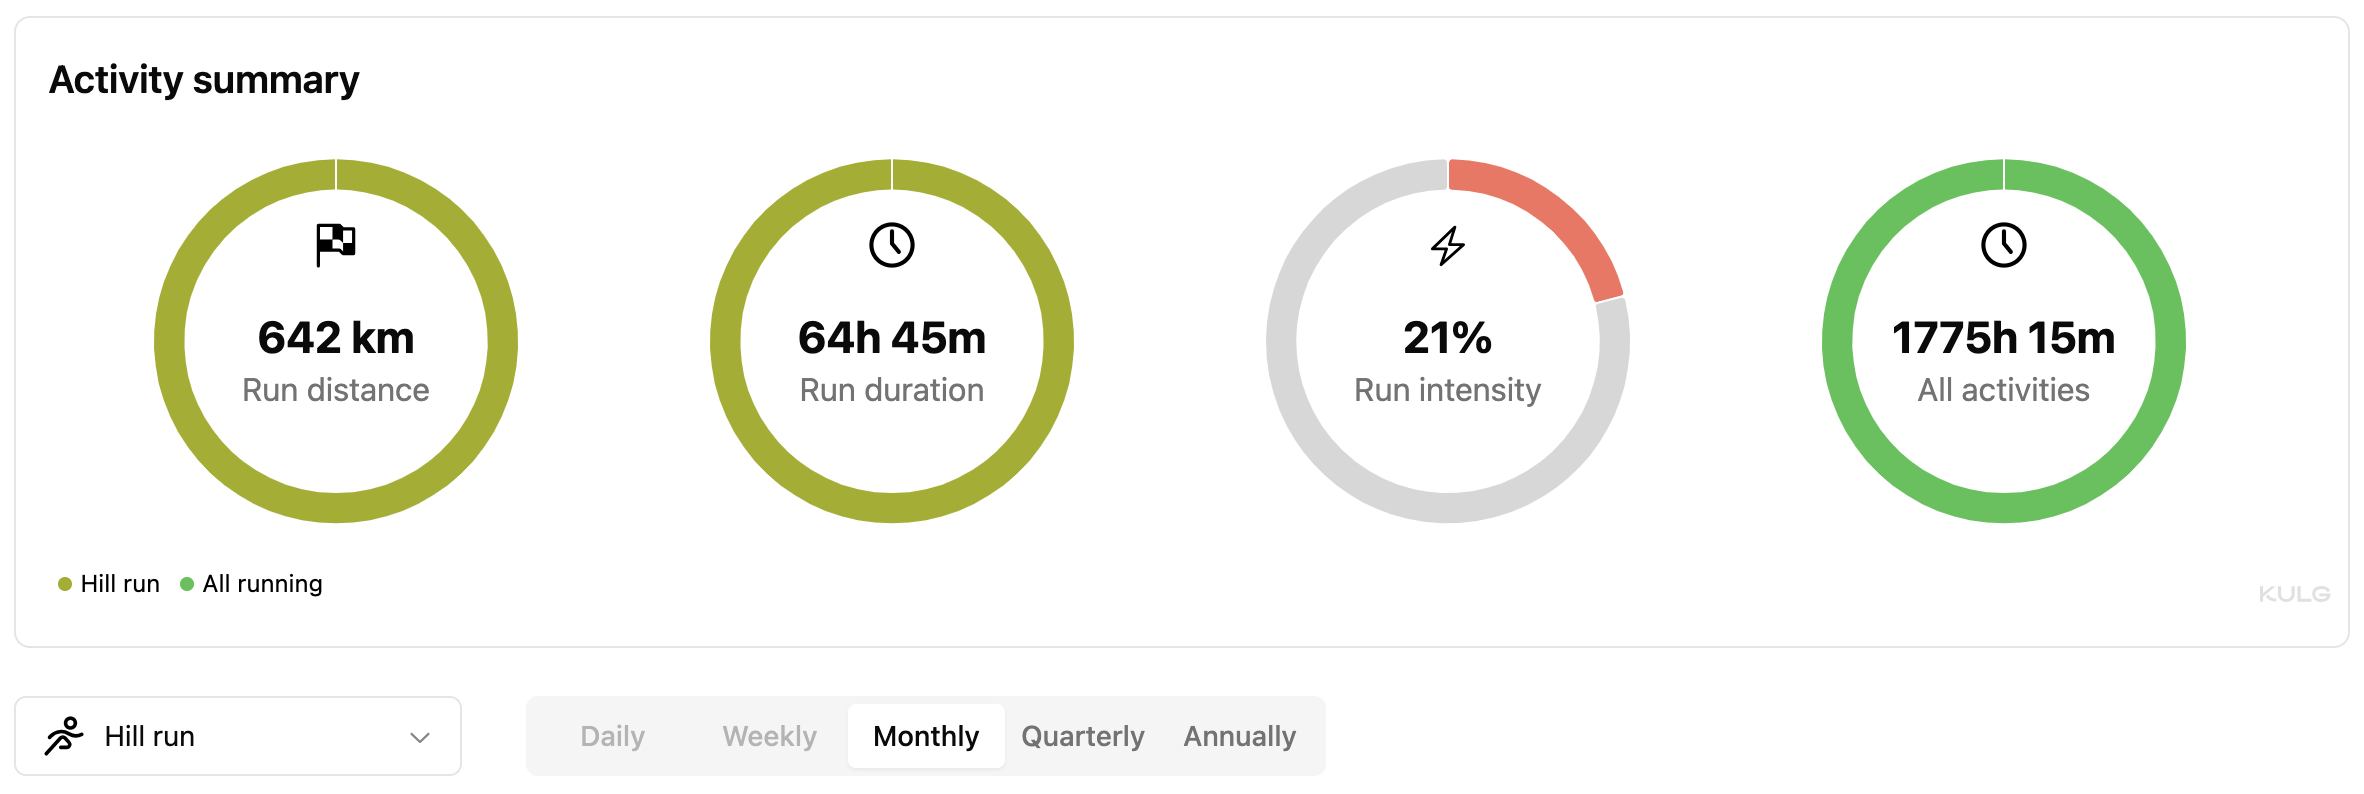
Why runners should track intensity 🔥🔥🔥
It’s really important for runners to track intensity % (i.e. the proportion of high intensity training from total distance) in order to ensure that you are not working too hard and not adding load too quickly. Monitoring your volume (distance), intensity and frequency is the key to ensure that you can run consistently and stay clear of injuries.
💡 The advised proportion of hard vs easy running based on widely accepted training principles for balancing stress and recovery is up to 20% hard and 80% easy. For shorter time frames like a week it may be acceptable to have a bigger % of high intensity running - e.g. when you’re tapering and doing a race. But for longer time frames, it is better to err on the side of caution and keep the high intensity load below 20% and even around 10% during the base phase. The bigger the weekly running volume, the more relevant it is to track intensity. So, higher weekly intensity % should be an exception and is a clear risk factor when done over longer periods of time.
NB! KULG App calculates high intensity based on what you have marked as “high intensity km”. It let’s you track high intensity kilometres on different types of runs, so you can monitor how much of your total running volume felt hard and how much felt easy. This way you can track intensity more accurately and ensure you are not working too hard. Strides at the end of an easy run, tempo splits, short intervals, hill sprints, the high end of progression runs and races all add up, even if they are not always entirely “hard” workouts. It’s useful to develop your own consistent logic for understanding what is “hard” and what is “easy” for you but a good recommendation is that high intensity is a run done in heart rate zone 3 or above (higher than ca 80% of your maximum heart rate) or at an effort level of 6 or higher on a 10-point scale. → Read more
We’ve also updated the total activity time pie chart, summarising different types of running activities to make it easier to compare how much time you’ve spent on different cross-training activities.