Recovery graph — what can I learn?
Written By KULG App
Last updated 2 months ago
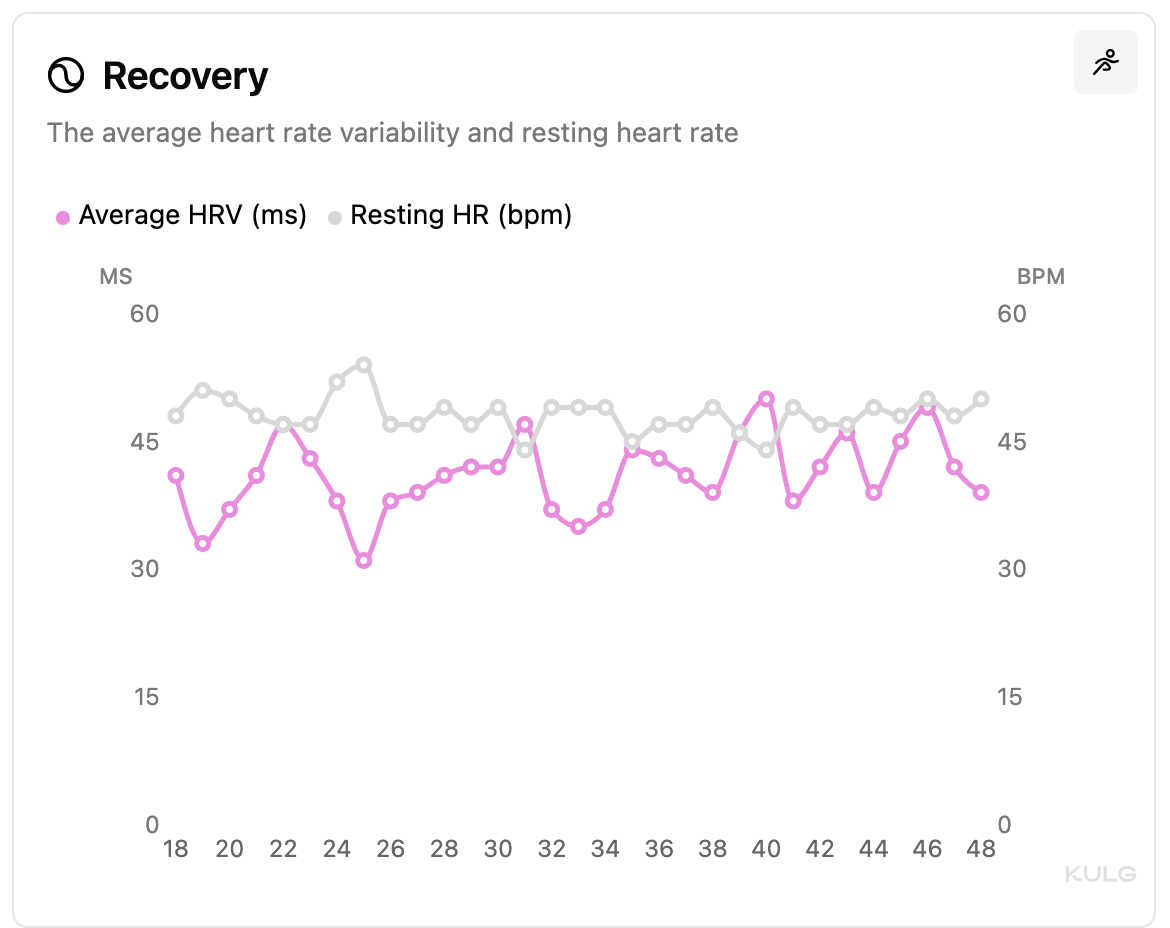
KULG Recovery graph shows your heart rate variability (HRV) and resting HR (RHR) trends.
Resting heart rate is the number of times your heart beats per minute (bpm) while at rest and a key indicator of fitness level and recovery status. You can measure RHR either in the morning or during sleep but it is advised to measure resting HR according to the same logic to be able to see reliable trends and patterns. Nighttime measurements that capture a longer, uninterrupted period when the body is fully relaxed can be more reliable.
Heart rate variability indicates the variation in time between heartbeats measured in milliseconds (ms), representing the time variation between consecutive heartbeats. Tracking HRV over time helps assess recovery and stress levels and enables to identify patterns in your body’s response to training, allowing for adjustments that optimise performance and prevent overtraining. Nightly measurements offer a clearer picture of baseline recovery trends.
NB! Daily option is available if the selected time frame is within 6 months and weekly if it’s within 1 year.
Additionally, the graph is not limited to running. You can select any other sport and view your heart rate variability and resting HR trends for that sport, giving you a comprehensive overview of all your sports activities.
Tips for interpreting recovery data 💡
→ Generally speaking, the lower your resting heart rate and the higher the HRV relative to your individual baseline, the better the recovery and overall cardiovascular health.
→ Focus on weekly or monthly trends rather than fixating on specific numbers from day to day; a high resting HR or low HRV may just indicate you need a bit more rest.
→ HRV is highly influenced by sleep quality, stress, nutrition, consumption of alcohol as well as training.
→ It is useful to view resting HR and HRV together - if both metrics trend in the wrong direction, it makes sense to hold back with high intensity training.
Data accuracy ⌚️
We suggest measuring nighttime HRV and resting heart rate (RHR) for better accuracy. Whether you choose to measure these metrics at night or during the morning/daytime, it's important to maintain consistency in your approach to identify comparable trends and patterns. Different devices measure RHR and HRV using varying methods, either providing an average based on a few hours of data or continuous tracking.
Overall, Oura and Whoop are often considered to provide more accurate RHR and HRV measurements due to their focus on sleep and recovery metrics. Watch apps, e.g. Garmin are also reliable, but performance can be slightly more variable depending on your activity level and how consistently the watch is worn.