Distance graph — what can I learn?
Written By KULG App
Last updated 2 months ago
One of the most relevant metrics to stay on track with your goals is to follow how much you run on a weekly or monthly basis. It is also very useful to track how frequently you run - sometimes it is easier and less taxing on your body to add another run per week, rather than just run longer.
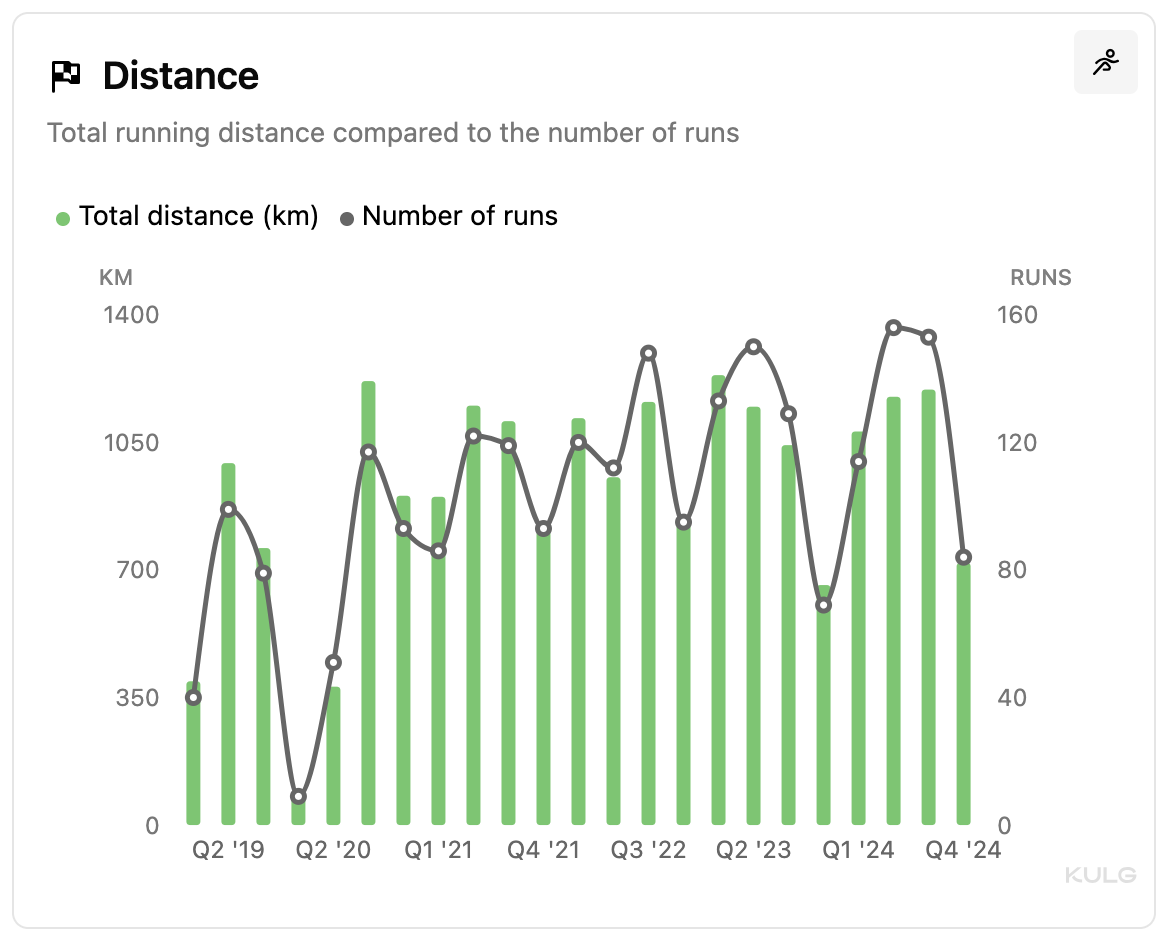
KULG Distance graph shows your total running distance (km) and the number of running activities in a given time frame. You can compare your running distance on a daily, weekly, monthly, quarterly or annual basis and dig deeper into how much and how often you’ve completed different types of runs.
Additionally, the graph is not limited to running. You can select any other sport and view your total distance and number of activities for that sport, giving you a comprehensive overview of all your sports activities.
NB! Daily option is available if the selected time frame is within 6 months and weekly if it’s within 1 year.
You can make sure to track the number of runs accurately by marking which activities are separate workouts and which are part of a workout.
Tips to understand progress 💡
→ Check how your total run distance and frequency has increased over time to plan your progression so that the increase would not be too abrupt (below 20%).
→ Check how the distance of your long runs has changed over months to see how you’ve increased volume before an endurance event.
→ Check how many races you’ve completed in different quarters to see how this may have impacted your training and contributed to fatigue.