Feeling graph — what can I learn?
Written By KULG App
Last updated 2 months ago
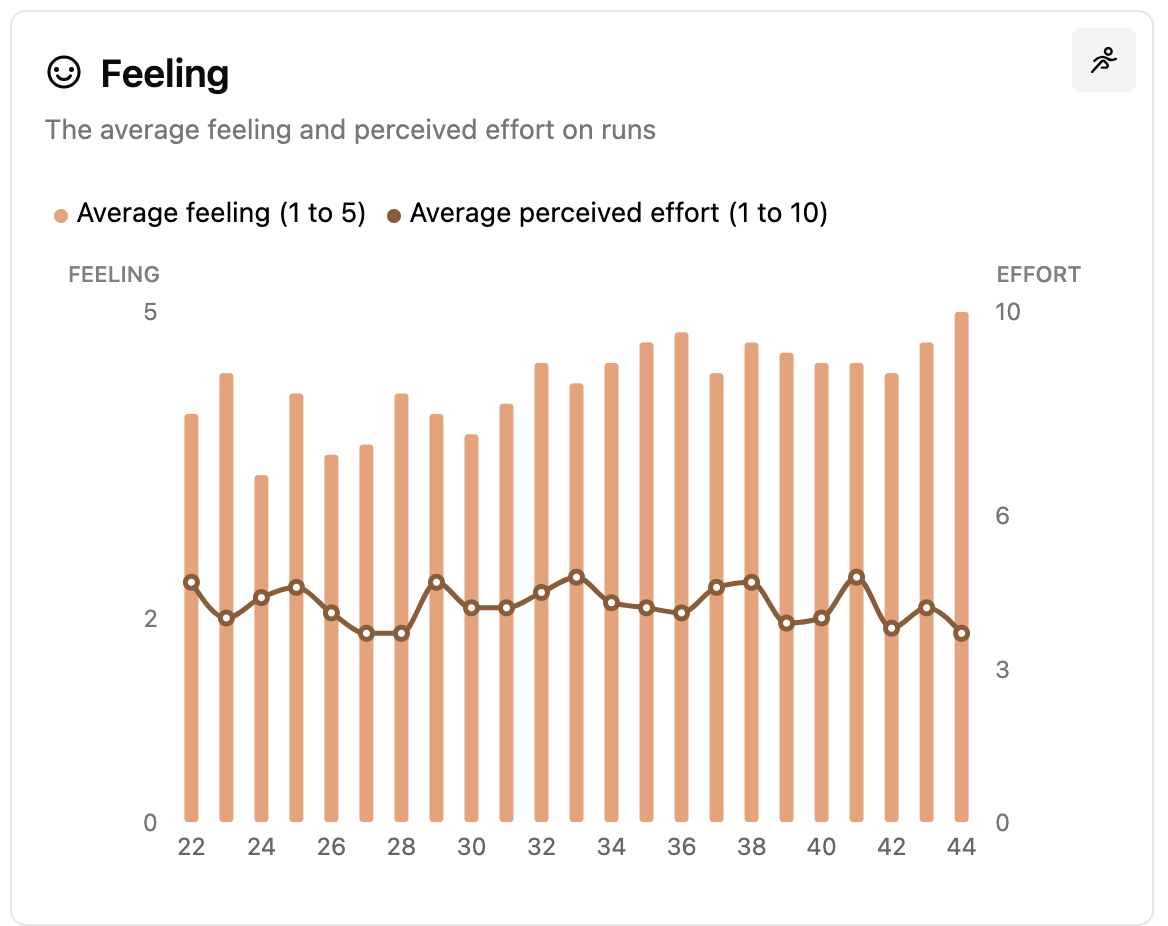
KULG Feeling graph displays your personal rating of how you feel on your runs alongside your perceived effort (rate of perceived exertion or RPE) or how hard the runs feel.
Feeling reflects your overall emotional state, mood, and stress level during a run on a scale of 1 to 5. Perceived effort, or RPE, is your personal perception of how hard the runs feel, rated on a scale of 1 to 10. Logging RPE on your runs helps you to learn to listen to your body and develop an intuitive understanding of your heart rate and how hard the body is working.
Tracking these qualitative measures enables you to see how your emotional and physical state has changed on your runs and adjust your training based on how your body is responding. Looking at your feeling and effort trends in comparison with your performance can indicate signs of fatigue at an early stage and highlight the need to focus on recovery, preventing overtraining, getting sick or injured.
NB! Daily option is available if the selected time frame is within 6 months and weekly if it’s within 1 year.
Additionally, the graph is not limited to running. You can select any other sport and view your feeling for that sport, giving you a comprehensive overview of all your sports activities.
Tips to understand progress 💡
→ Compare feeling and perceived effort trends to pace, heart rate and distance to see how your subjective feel changes as training volume or intensity increases or decreases.
→ If you run faster in training but have a higher RPE and higher average heart rate, you may be just pushing harder, not necessarily getting better.
→ If you run slower but your RPE is also significantly lower than on your previous runs, then you may be improving, especially if your heart rate data supports this.
→ If your feeling trend is going down and/ or effort up, it may be an indicator of fatigue. External stressors only add to the stress of training and make recovery more difficult.