Duration graph — what can I learn?
Written By KULG App
Last updated 2 months ago
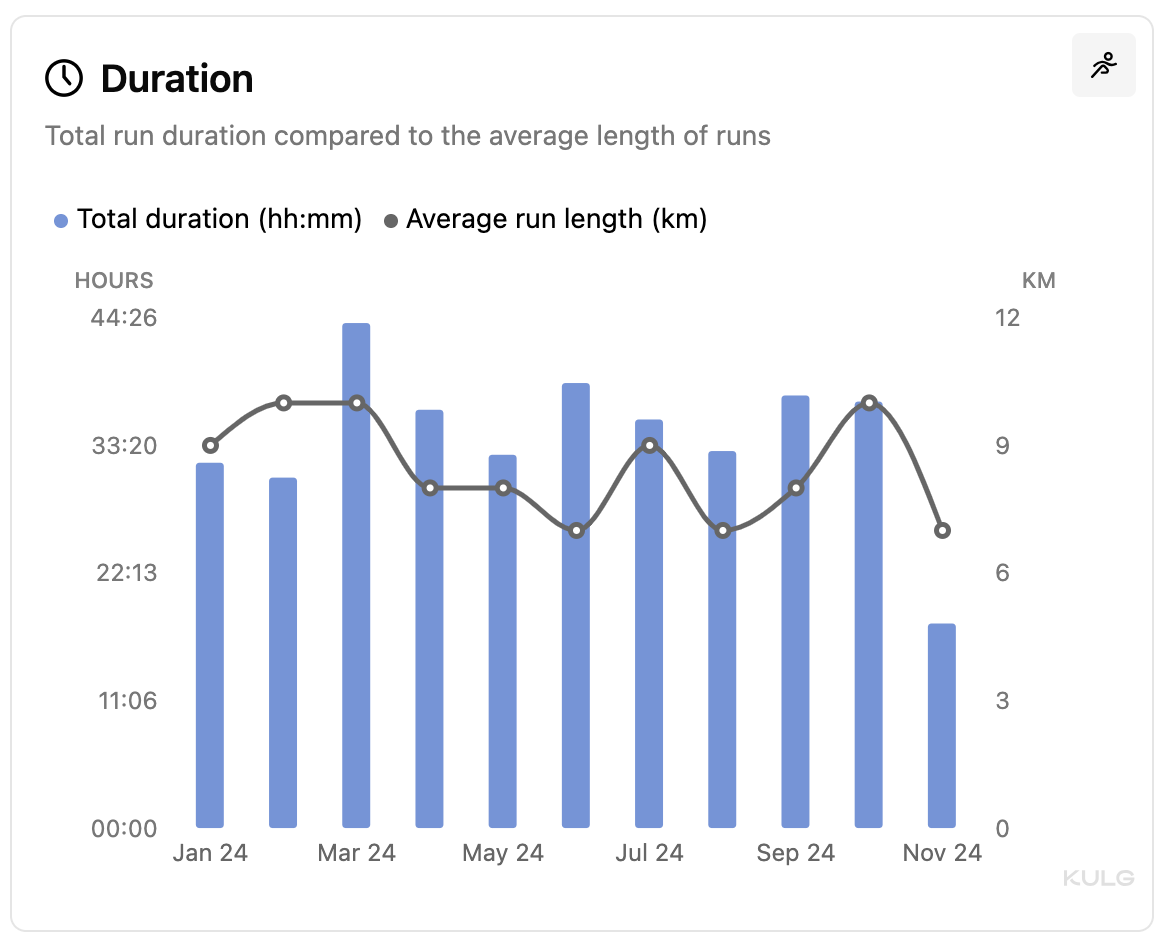
KULG Duration graph compares the total run duration to the average length of your runs.
By looking at duration and the average length of your runs, you can ensure gradual progression in training, especially when preparing for longer distances or improving endurance. Tracking duration is often more useful than tracking distance because distance goals are impacted by how fast you are running, whereas duration goals are more objective.
NB! Daily option is available if the selected time frame is within 6 months and weekly if it’s within 1 year.
You can make sure to track the average run length accurately by marking which activities are separate workouts and which are part of a workout.
Additionally, the graph is not limited to running. You can select any other sport and view your total duration and average for that sport, giving you a comprehensive overview of all your sports activities.
Tips to understand progress 💡
→ Check how the duration of your runs has changed over months to see your progression in training time before an endurance event.
→ Check how the average length of your long runs or races has changed over different time frames to see how this may have impacted your training and performance.